

The Power of Certainty: Introducing the Marubozu Candlestick Pattern
Most trading beginners find themselves confused when studying stock charts because candlestick patterns create complex visualizations. All these candlestick patterns, including spinning tops, dojis, and hammers, appear to demonstrate a draw that shows competition between buying and selling forces. It’s frustrating, isn’t it? As traders, we crave clarity. Knowledge about market control between buyers and sellers allows traders to make better trades and execute informed investments. The market shows clear answers only sporadically; yet occasionally, it displays them with great audibility. A Marubozu candlestick appears as that shout, which indicates market direction.
Organizations that rely on clear-cut decisions find value in using Marubozu candlesticks. The pattern indicates with absolute certainty that buyers hold complete market control while showing their dominance. or “Sellers Dominating!” Due to its minimal wick presence, the Marubozu pattern delivers transparent information about the decisive market behavior of either buyers or sellers within a particular time period. A powerful trading signal emerges from this pattern that you can effectively learn to use.
And the best part? This piece will provide you with both tools along with the understanding you need to reach that goal. This extensive tutorial teaches you how to recognize Marubozu patterns and how to utilize them in trading practice alongside proper understanding methods. You can obtain our FREE Marubozu Candlestick Patterns Cheat Sheet as a downloadable PDF through this internal link at the bottom of the page. This quick reference tool will enable you to quickly read and understand these strong price formation indicators. Does it sound appealing to eliminate confusion through the adoption of Marubozu? Let’s dive in!


What Exactly IS a Marubozu Candlestick?
Let’s start with the basics. Marubozu derives from the Japanese language, where it signifies “close-cropped” or “bald.” The candlestick shows a full-bodied appearance with minimal wicks extending from both ends, making it comparable to someone who is bald. The shape of Marubozu looks like a block with strong rectangular lines, which creates a powerful contrast against other candlesticks on the chart.
Key Characteristics of a Marubozu:
The Dominant Real Body:
Real bodies stand central in any candlestick formation because they demonstrate the complete price shift between opening and closing levels in a given trading period from minutes to weeks. A Marubozu candlestick has an outsized real body that exceeds the typical size of other candlesticks observed on the chart. A single directional price movement occurs to such an extent that it produces a large real body. Such a pull-wrestling battle, where one side crushes the other, resolves into the depiction of a massive real body.
The Absence of Wicks (Shadows):
This is the defining feature of a true Marubozu. Wicks (also called shadows) represent the price extremes reached during the trading period beyond the opening and closing prices. The absence of wicks (or the presence of extremely small ones) means that the opening price was essentially the low of the period, and the closing price was the high (or vice versa for a bearish Marubozu). This signifies relentless buying or selling pressure, with very little pushback from the opposing side.
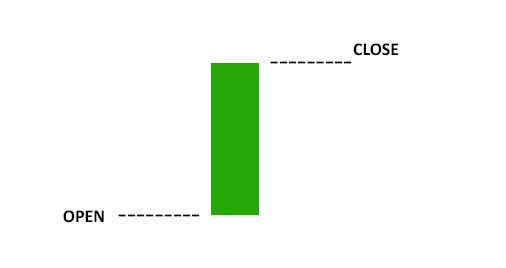
Bullish Marubozu (Green/White):
A bullish Marubozu opens at its absolute low and closes at its absolute high. The entire trading period was dominated by buyers. Think of it as a green light to consider a potential long (buy) position, especially if it aligns with an existing uptrend (more on trading strategies later).
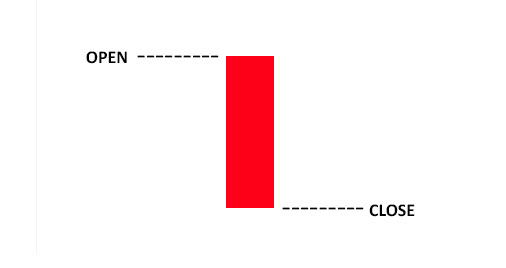
Bearish Marubozu (Red/Black):
The bearish Marubozu (red/black) pattern begins operating from its maximum point and finishes at its minimum possible value. The period existed entirely under seller control. A weak signal showing potential vulnerability emerges, which creates a potential selling opening inside downward trends.
Beyond the "Perfect" Marubozu: Opening and Closing Marubozus
Opening Marubozu:
The opening Marubozu type displays one candle wick yet keeps the extreme price at the opposite end of its range.Bullish Opening Marubozu: A Bullish Opening Marubozu contains lightly shaded upper shading, which indicates minimal selling pressure during the period, yet the open price matches the session minimum. Even though this formation remains optimistic, it shows slightly less strength than a flawless Marubozu.
Bearish Opening Marubozu:This candle pattern combines a minimal lower wick with an open price matching the highest point in that period. Still very bearish.
Closing Marubozu:
The opposite of the Opening Marubozu. A single wick marks one side of the pattern, yet the period ends with its extreme positioned on the opposite side.Bullish Closing Marubozu: The Bullish Closing Marubozu displays minor selling pressure through its lower wick while the trading session ends at the period’s highest price point as its main feature. Still a strong bullish signal.
Bearish Closing Marubozu: The price finishes at the session’s minimum value while presenting a small upper wick because early market activity showed some purchasing interest. Still a strong bearish signal.
The variations in Marubozu candlestick patterns possess strong directional bias even if they are not entirely perfect. The essential factor is that each period’s extreme position functions as either the maximum point or the minimum point of the time span. A wick must stay small in comparison to the total candle size, which should measure less than 5-10% of the overall length. A candle that contains big wicks becomes ineligible to be classified as a Marubozu pattern.
Identifying a Marubozu: Your Step-by-Step Checklist
The next stage involves practical application of the information you acquired about the theory. Price chart readers can use this basic guide to detect Marubozus patterns.
Train Your Eyes for the Long Body:
Review your chart with an eye toward long bodies by scanning through it. Your search focuses on candles that present significantly greater height (longer real body) than those surrounding them. They should become the highest building in their residential area. Visual assessment represents your first selection method.
Inspect for the Absence (or Near-Absence) of Wicks
The examination of wicks’ absence or their proximity to the candle is the most important step. Examine the candidate with a prolonged real body to determine whether the wicks remain shadow-free both above and below. Remember:
Perfect Marubozu: No wicks at all.
Opening/Closing Marubozu: A Marubozu shows only one tiny wick, which positions itself next to the extreme on the opposite side of the pattern.
Near-Marubozu: The pattern remains valid with small wicks measuring at least 5-10% of the overall candle duration, yet larger wicks make it invalid.
Confirm the Color and Direction:
Check whether the candle shows bullish adoption (green or white color indicating buying pressure) or bearish shifts (red/black signals show selling pressure). No one knows what lies beneath a red or black candle unless you can identify whether it represents bearish (selling pressure) behavior. The color dictates the directional bias.
Context is Key:
Finally we can use supporting condition to improve trading result
Consider Volume to eliminate False Signals
Look for Open or Closing price variation.
Example Charts (Bullish and Bearish):
Example 1: Perfect Bullish Marubozu:
Show a clear, clean bullish Marubozu with no wicks.
Example 2: Perfect Bearish Marubozu
Show a clear, clean bearish Marubozu with no wicks.
Example 3: Near-Bullish Marubozu (small wick)
Show a bullish candle with a very small wick (either upper or lower).
Example 4: Near-Bearish Marubozu (small wick)
Show a bearish candle with a very small wick.
Important Note: Students must understand that they should not struggle to find perfect Marubozu patterns across all time horizons. They are relatively rare. Pay attention to the primary elements which include long real body and small wicks coupled with powerful directional movement. Small wick near-Marubozus patterns together with Opening/Closing variants tend to occur even more often than traditional Marubozus patterns.
Trading the Marubozu: Strategies for Profit and Risk Management
The true challenge emerges after detecting a Marubozu pattern. Lighting a Marubozu successfully represents the main difficulty and the primary benefit for traders. Like all other candlestick patterns, the Marubozu operates independently as a sole trading method. Investors should utilize Marubozu analysis as one of multiple technical tools within a plan that includes defined risk management strategies.
Crucial Pre-Strategy Considerations:
Trend is Your Friend: Marubozu performs optimally when it confirms current market trends. A bullish Marubozu becomes a powerful signal when it occurs within an established uptrend, while such patterns lose their strength when happening in declining price environments. Monitor the market trend using trendlines combined with moving averages or alternative analytical methods.
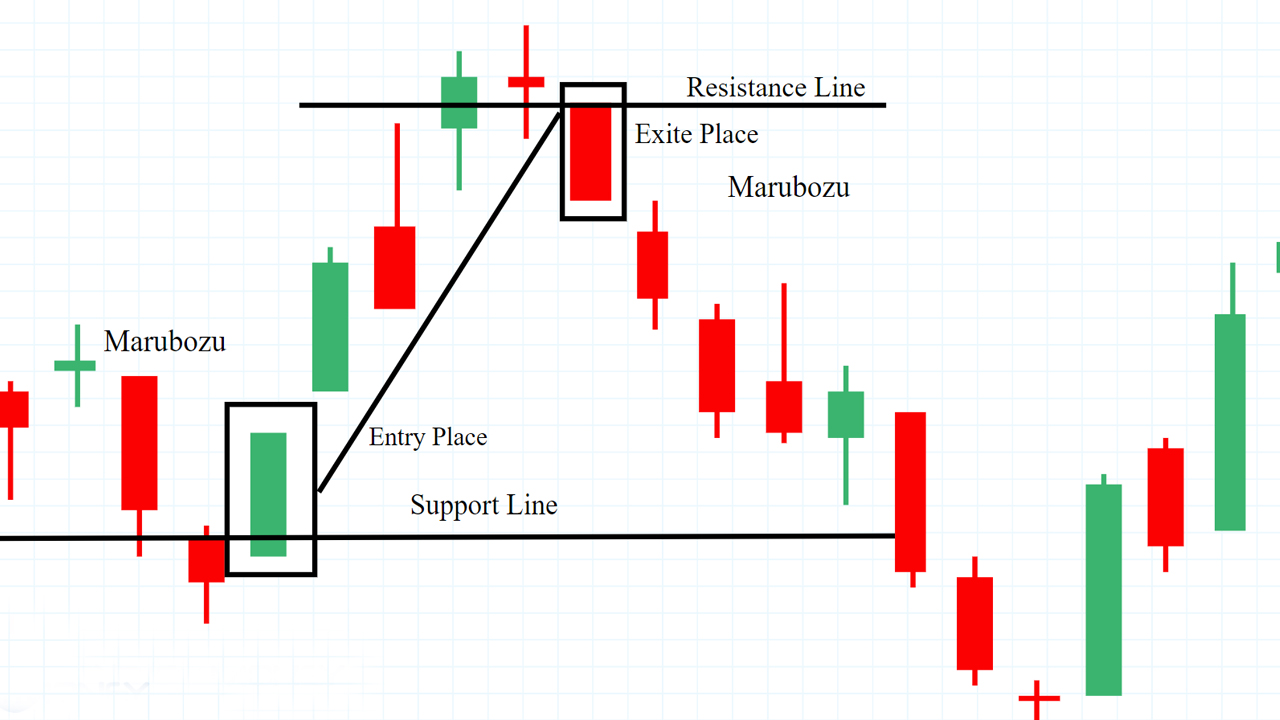
Support and Resistance: Analyze Marubozus that form at important support and resistance markups. When a bearish Marubozu breaks away from resistance while a bullish Marubozu absorbs support levels, they create exceptionally strong trading signals.
Volume Confirmation: The strength of a Marubozu candle should be validated through higher total trading volume. A Marubozu_SIGNAL_ with heavy trading volume indicates a robust movement while decreasing the chances of wrong indications. Marubozu signals require close scrutiny when the trading volume stays low.
Trading Strategies (with Examples):
Continuation Patterns (The Most Common and Reliable):
Continuation Patterns (The Most Common and Reliable):
This is a classic continuity signal. After confirming the trend and identity of Marubozu (with an ideal increased volume):
- Entry: Consider entering a long (buy) position after the Marubozu stearine light is closed. Some traders prefer to wait for a small withdrawal, while others come in immediately.
- Stop Loss: Place the stop-loss order under the lower part of the Marubozu-Sstearinlys. You can use the recent swing low for a slightly larger stop.
- Profit Target: Project potential Benefit Objective Fibonacci extensions, previous resistance levels or a measured trick based on the size of Marubozu.
Bearish Marubozu in a Downtrend:
The mirror photograph of the bullish state of affairs. After confirming the downtrend and figuring out the bearish Marubozu:
- Entry: Consider getting into a quick (sell) function after the Marubozu candle closes.
- Stop-Loss: Place your stop-loss order above the high of the Marubozu candle, or above a latest swing high.
- Profit Target: Use Fibonacci extensions, previous support levels, or a measured circulate.
Breakout Patterns (High Reward, Higher Risk)
Marubozus can be powerful indicators of brakes from consolidation patterns (such as triangles, rectangles or flags).
Bullish Breakout: If fee breaks above a key resistance degree and closes as a bullish Marubozu, it strongly confirms the breakout. This is a very competitive access.
Entry: Enter long after the breakout and close of the Marubozu.
Stop-Loss: Place the stop below the low of the Marubozu, or below the broken resistance level (which should now act as support).
Profit Target: Project potential profit targets based on the size of the consolidation pattern or Fibonacci extensions.
Bearish Breakout: If price breaks below a key support level and closes as a bearish Marubozu, it confirms the breakdown.
Entry, stop-loss and profit targets opposite of bullish
Reversal Patterns (Use with Extreme Caution!
Marubozu pattern has significant limitations at Reversal signal, so trade this with extream causion and filter with proper filter.
Bullish Marubozu after a Prolonged Downtrend: This could indicate a bottom, but only if it’s accompanied by:
Significantly Increased Volume: A massive spike in volume adds credibility.
Bullish Follow-Through: The next candle(s) should also be bullish, confirming the buying pressure.
Break Above Resistance: Ideally, the price should also break above a nearby resistance level.
Bearish Marubozu after a Prolonged Uptrend: The opposite – a potential top, requiring:
Significantly Increased volume.
Bearish follow Through
Break below support
Essential Risk Management:
Never Trade Without a Stop-Loss: This is non-negotiable. The Marubozu can be effective, however it is now not infallible. Always have a predetermined exit point to limit your losses if the alternate goes towards you.
Position Sizing: Don’t chance too much of your buying and selling capital on any single trade. A commonplace tenet is to risk no more than 1-2% of your account balance on anyone position.
Avoid Trading During Major News Events: Economic news releases, income reviews, and different widespread events can cause severe volatility, making candlestick styles (which include the Marubozu) much less reliable. It’s frequently high-quality to stand apart for the duration of these periods.
Filtering for better accuracy
Use supporting signals along with Marubozu patterns:
- Volume : Look for Volume spike or particularly high volumes.
- Support and resistance: Consider buying and selling while this pattern makes aid at a Support line or face resistance on the Resistance line.
- Trends: Identify what modern fundamental and minor tendencies are.
Advantages and Limitations of the Marubozu: A Balanced View
Like any technical indicator, the Marubozu has its strengths and weaknesses. Understanding these helps you use it more effectively.
Advantages
Simplicity and clarity: Marubozu is visually striking and easy to understand, even for early traders. It cuts through noise and gives a clear message about market spirit.
Strong speed signal: The lack of VIX indicates the decisive value movement in one direction, suggesting that the speed is likely to continue (at least in a short time).
Versatility: Marubozu can be used in different time frames (from short -term intraday charts to long -term weekly or monthly charts) and in different markets (warehouse, forex, goods, cryptocurrency).
High probability (when used properly): When the right trend is combined with analysis, support/resistance and risk management, Marubozu can be a trade signal with high esophagus.
Limitations:
Not a standalone system: Marubozu will be used in combination with other forms of technical analysis and a comprehensive trade scheme. To trust that it is a recipe for a complete disaster.
Low-endangered conditions can be less reliable: In the markets with thin trade or during a period of low liquidity, a Marubozu may not be so meaningful. Lack of volume weakens the signal.
Reversal signals require additional precautions: As discussed, it is much riskier to use Marubozu for reversal than to use it for continuity patterns. Always look for further confirmation.
False characters exist: As with any trading pattern, Marubozu is not foolish. It can be fake signs and can occur. This is why risk management (stop-loss) is so important.
Relatively rare: fully formed marubozas (no vicks in everything) are not incredibly normal. You may want to meet closest Marubozu and open variations more often.
Your FREE Marubozu Cheat Sheet: Download Now!
We’ve protected a number of ground in this guide, and we want to make sure you have the whole thing you need to with a bit of luck perceive and exchange Marubozu styles. That’s why we’ve got created a complete, FREE Marubozu Candlestick Patterns Cheat Sheet in PDF layout.
What's Inside Your Cheat Sheet:
Short Summary:
A quick repetition of all main concepts: What is a Marubozu, different types (fast, recession, opening, closure) and main characteristics.
Visual Cheat Sheet (Printable):
A one-page (or two-page) visually appealing guide with:
Clear images of all the Marubozu variations.
Key identification criteria in bullet-point format.
Basic trading strategy diagrams (continuation and breakout).
Stop-loss placement guidelines (visual reminders).