candlestick pattern gallery
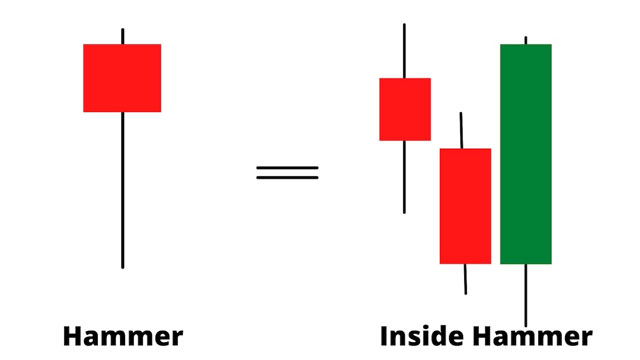
hammer candlestick in uptrend
Hammer Candlestick Patterns Meaning
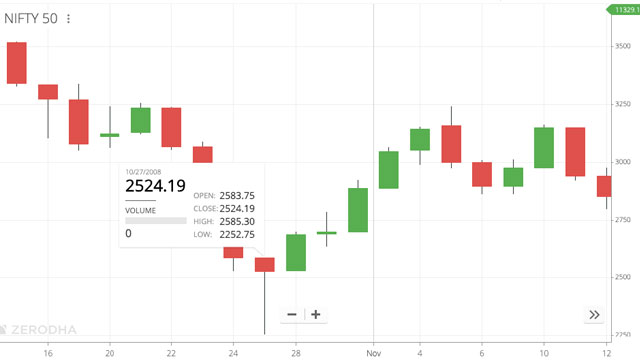
Images for Hammer Candlestick Patterns
Introduction: Are You Missing Out on Hidden Market Reversals?
Stock chart analysis presents itself like a complex cryptographic system to our viewing eyes. The market uses unique communication methods that are difficult for you to understand. You’re not alone. Most traders from all experience levels struggle to forecast market activities while searching for profitable investment options.
Moreover, the market functions through a distinct communication channel based on price movements. Candlestick patterns constitute one of the most potent systems within the language of price action. Within candlestick patterns, the Hammer dazzles onlookers by announcing potential bullish transformations that may be forming under current market conditions.
When you detect a distinctive indicator showing the downtrend fatigue and the upcoming buyer participation you will immediately understand the market sentiment change. The power of the hammer emerges as its distinctive feature. The graphical representation of market sentiment change counts as one of the clearest visual signals appearing on trading charts. The pattern depicts a fight between bullish and bearish traders while showing that the bulls are currently leading the battle.
This extensive manual explores the complete assessment of the Hammer candlestick pattern in depth. The following resource breaks down the Hammer’s structure while studying its psychological components and introduces hands-on trading methods to benefit from its effectiveness. The market presents a major advantage through the Hammer’s understanding to traders who work on different time frames from day to swing and beyond long term.
And to make things even easier, we’re offering a free, downloadable PDF guide that you can keep as a handy reference. You’ll find the download link later in this article.
Demystifying the Hammer: What Exactly Is This Candlestick?
Let’s start with the basics. As a single-candlestick pattern, the Hammer indicates the potential beginning of an uptrend after a price decrease.
A blacksmith creating something new through hammering metal shapes the foundation of understanding this pattern. The Hammer candlestick pattern shows market forces of bullish pressure hammering bearish pressure until the market undergoes its reformation.
Here’s what defines a Hammer candlestick:
Small Real Body:
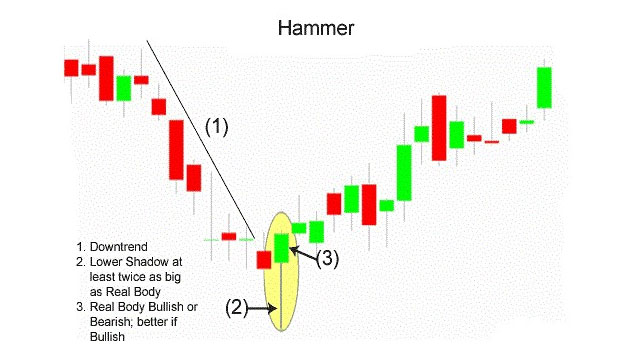
The difference between the starting and closing prices is known as the real body. This body is comparatively tiny in a hammer. There are two possible outcomes: bullish (closing price above opening price) and bearish (closing price below opening price). Although a bearish (red or black) body can still be a legitimate Hammer, a bullish (green or white) body is typically seen as a stronger indicator.
Long Lower Shadow (Wick):
This is what makes the Hammer unique. A lengthy line that extends downward from the actual body is the lower shadow, also referred to as the wick or tail. This bottom shadow should ideally be at least twice as long as the actual body. This lengthy shadow suggests that the price dropped considerably throughout the trading session before rising quickly again.
Little or No Upper Shadow (Wick):
Ideally, the Hammer should have little to no upper shadow. A small upper shadow is acceptable, but a long upper shadow diminishes the strength of the pattern.
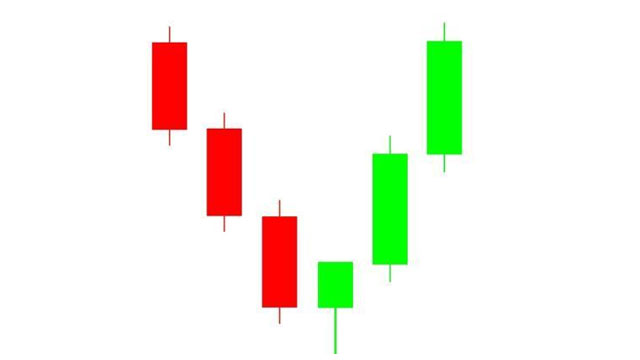
The Psychology Behind the Hammer: Understanding the Market's Story
Traders expect a trend reversal when they see the Hammer. This occurs when the price of the asset is decreasing, indicating that the market is moving downwards and trying to change momentum.
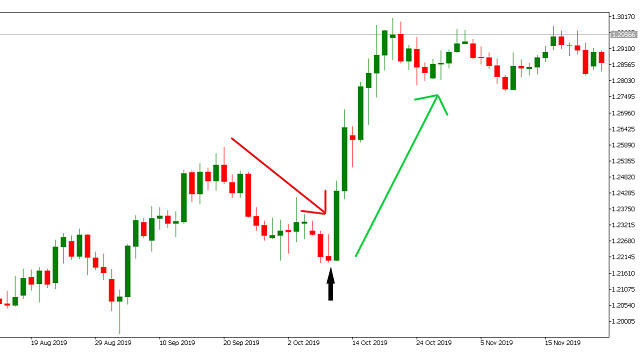
The formation of a hammer candlestick in a decline suggests an active day in the market – the price dropped after the market opened but closed above the opening price – and all this is happening over a period of time. The position of the hammer also gives important signals. Traders consider it a strong signal if it is preceded by three or more bearish candles. Furthermore, the next candle formed after the hammer candlestick should act as a confirmation and close above the closing of the hammer candle.
When all these events occur in the same line, traders can consider it a strong signal of a potential trend reversal and enter a long position. Traders take a position to enter the market during the formation of a confirmation candle. But like other candlestick formations, the Hammer candlestick pattern should not be treated alone.
Here’s the narrative:
Bearish Control: The price demonstrates a lowering trend since the sellers (bears) maintain control over the market direction. The market forces have driven prices down through multiple decreasing stages.
Price Plunge: During the designated trading time frame (day or hour and so on), bear traders maintain control over prices, which fall to their lowest point yet. A significant price descent appears as a long lower shadow in this pattern.
Bullish Rejection: But then, something happens. Buyers (bulls) step in. They see the price as oversold and an opportunity to buy at a discounted price.
Strong Rebound: These buyers aggressively push the price back up, often towards the opening price or even higher. This strong rebound creates the small real body.
Potential Shift in Momentum: The Hammer confirms that downward pressure from bears encounters strong resistance during trading sessions. The bulls have proven their existence alongside their started resistance to bear pressure. This signal demonstrates that power dynamics may be about to change, but it does not indicate a certain market turnaround.
Think of it as a tug-of-war. Bears have been consistently pulling toward the downward direction. A hammer symbolizes bulls taking the rope to start reversing the trend, which indicates potential alterations in game directions.

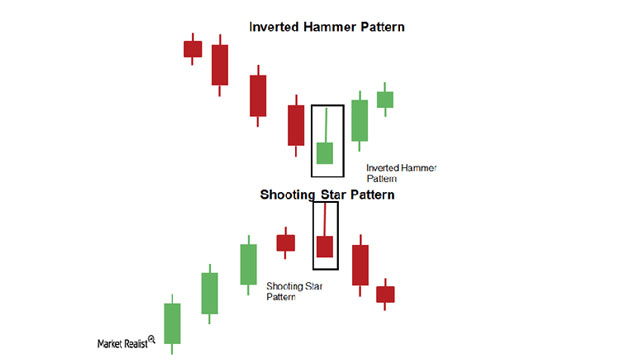
inverted hammer candlestick
What is Hammer Candlestick
hammer candlestick
Identifying a High-Probability Hammer: Not All Hammers Are Created Equal
You should identify high-probability Hammers, which provide ideal trading prospects because any Hammer-like pattern in that area might not provide enough reliability. Here’s what to look for:
Preceding Downtrend is Crucial: A hammer pattern functions only after a well-defined and prolonged downward movement. This reversal indicator needs an object to turn around its direction. The chances of success with a hammer pattern decrease when it emerges within a trading range or after a weak downward trend.
Length of the Lower Shadow: Length of the Lower Shadow: The longer the lower shadow, the stronger the potential signal. Marks that surpass the real body’s length by two times point to a powerful rejection of price lowering.
Size and Color of the Real Body: Small real bodies appear superior to their larger counterparts, although their bullish or bearish orientation determines their meaning. An upward-trending body serves as a powerful indication that traders respect because prices rose above opening levels.
Confirmation is Non-Negotiable: The Hammer is a potential signal, not a guarantee. You must wait for confirmation before entering a trade.
Confirmation Signals: Turning Potential into Profit
Successful trade identification relies on confirmation to eliminate false trading signals while raising anticipation of successful outcomes. As a method to verify Hammer patterns, you need to review the following indications:
Bullish Candlestick on the Following Day: Bullish candlestick formation on the following day represents the most popular confirmation method. Bullish candlesticks with closing prices above opening prices should be the main signal reference point on the next day following a Hammer pattern. The recorded buying pressure from the Hammer pattern continues.
Price Breaking Above the Hammer’s High: When prices exceed the high point of the Hammer candle, this serves as one of the confirmation signals indicating bullish control. The price movement demonstrates that bulls successfully control the market trajectory because they continue to elevate the price from its previous hammer high.
Increased Trading Volume: Search for increased trading volume on the day of the Hammer formation as well as on the confirmation day. Strong market momentum exists when trading volume reaches high levels.
Gap Up: A gap up in price on the day following the Hammer can be a powerful confirmation signal. This shows strong buying interest and a clear break from the downtrend.
Trading Strategies: Putting the Hammer to Work
Now that you know how to identify and confirm the Hammer, let’s talk about how to use it in your trading strategy.
Entry Point:
Conservative Approach: Enter a long position at the close of the confirmation candlestick. Entering at the close of the confirmation candle guarantees the persistent bullish trend.
Aggressive Approach: The aggressive method involves entering into a long position after the price manages to exceed the high point of the Hammer candlestick pattern. Entering before confirmation can be beneficial, though the risk of price failure at the breakout point is increased.
Pullback Entry: Investors using this strategy should wait for a temporary price adjustment toward the high endpoint of the Hammer pattern before entering the market. Fast entry at this point will let you secure a lower asset price and lower exposure to market fluctuations.
Stop-Loss Placement:
Below the Hammer’s Low: For your stop loss, place an order that rests just below the Hammer’s lowest point of its price shadow. The stop-loss should be placed below the low part of the hammer’s shadow to guard against price reversals and continued downward movement.
Below a Recent Swing Low: If there’s a recent swing low near the Hammer, you can place your stop-loss below that level for added protection.
Profit Target:
Fixed Risk-Reward Ratio: Fixed Risk-Reward Ratio: Use a fixed risk-reward ratio, such as 1:2 or 1:3. Your potential net profit should be twice or thrice greater than your maximum loss amount starting from your entry price to your stop-loss point.
Resistance Levels: Set your profit target just beneath any expected resistance levels that could create selling pressure to affect the price movement.
Fibonacci Extensions: Use Fibonacci extensions to project potential price targets based on the previous price swing.
Hammer vs. Hanging Man: Spotting the Critical Difference
The visual appearance of The Hammer and The Hanging Man shows no difference, yet their meanings stand entirely opposite to each other. The correct distinction between these two cards proves essential.
The Key Difference: Prior Trend:
Hammer: Appears after a downtrend and signals a potential bullish reversal.
Hanging Man: Appears after an uptrend and signals a potential bearish reversal.
The “hanging man” pattern hangs from an upward trend, which indicates that a price decline will soon occur. The hammer formation indicates that the price decline period has ended.
Beyond the Hammer: Combining with Other Indicators
The Hammer tool by itself is a powerful indicator yet presents its best detection results when combined with other technical indicators. Here are a few examples:
Moving Averages: Use moving averages to identify the overall trend. A hammer forming near a moving average can provide additional confirmation of a potential reversal.
Relative Strength Index (RSI): Use the RSI to identify oversold conditions. A hammer forming when the RSI is below 30 (oversold) can be a strong signal.
Volume Analysis: Look for increased volume during the Hammer formation and on the confirmation day. Higher volume confirms stronger conviction behind the price movement.
Fibonacci Retracement Levels: A hammer forming at a key Fibonacci retracement level can provide a high-probability trading opportunity.
Limitations: Recognizing When the Hammer Might Fail
Trading methods lack complete reliability, and the Hammer includes these same limitations, among others. The essential need exists to understand the specific weaknesses of this approach:
False Signals: The Hammer pattern can produce false signals, especially in volatile markets. This is why confirmation is so important.
Market Context: An evaluation of The Hammer needs to take place within the framework of present market situations. An upward hammer inside a strong bear market shows low reliability but becomes more valid when the market has entered consolidation.
Individual Stock vs. Market Trend: Monitor both the performance of particular stocks and market-wide trends due to changes in market direction. The reliability of a hammer pattern in an individual stock varies when the market trend continues in a downward direction.
Subjectivity: Identifying the Hammer pattern can be somewhat subjective. Different traders may interpret the same candlestick differently.
Advanced Considerations: Tweaking Your Hammer Strategy
Hammer Variations: The Hammer has different variations, with one known as the “Inverted Hammer,” which requires attention from traders. An inverted hammer identifies itself through a long upper shadow parallel to a small lower shadow. The pattern indicates a possible bullish turnaround, which needs dual verification like standard hammer patterns.
Multiple Timeframes: Multiple Timeframes: Analyze the Hammer pattern on multiple timeframes. When analyzing Hammer patterns, traders should assess their significance based on the time frame since a Hammer pattern on a daily scale holds greater weight than one formed on a 5-minute scale.
Backtesting: A trading strategy needs to undergo backtesting before you trade with real funds. Analyzing the Hammer under different market circumstances through backtesting enables traders to develop and optimize their signal strategy.
Your Free Hammer Candlestick Pattern PDF Guide: Download Now!
Your learning journey regarding the Hammer pattern is set to progress to an advanced level. Users can access our free PDF guide for easy access at any moment through any location.
This PDF includes:
A concise overview of the Hammer candlestick pattern.
Clear diagrams and illustrations.
A checklist for identifying high-probability Hammers.
Example trading strategies.
A comparison of the Hammer and Hanging Man.
And much more!
Conclusion: Master the Hammer and Unlock Trading Potential
Any trading professional needs the Hammer candlestick pattern as a vital analysis instrument. Knowledge of Hammer anatomy, plus psychology and trading limitations, will help you identify bullish reversals more effectively to make trading decisions of higher quality.
The hammer serves as a single element among various factors to evaluate. Usage of this technical indicator alongside others should be combined with risk management strategies alongside continual learning pursuits.
The active market demands your trading methods should develop along with it. Leverage the challenge by staying curious because persistent work on your trading goals will lead to success.
Note: The information provided in this article is for educational purposes only and does not constitute financial advice. Trading involves risk, and you should consult with a qualified financial advisor before making any investment decisions.


