

Decoding Candlestick Patterns: Your Visual Guide to Understanding Market Sentiment
People frequently fail to grasp messages in conversations because they lack both tone of voice and facial expressions during communication. Although you would understand the verbalized statements, you would overlook an enormous aspect of their intended communication. Basic line charts of stock prices show closing values which leaves investors with no visibility regarding how prices changed between each session. The interpretation system depends on candlestick patterns as major indicators. These visual indicators function as market body language, which shows an illustrated competition between market participants while simultaneously suggesting future price directions.
New investors and traders usually begin with the fundamental line chart, which shows asset closing prices throughout time. The chart structure remains simple enough for immediate comprehension, although its functional range is very restricted. The chart masks the market volatility together with the perpetual fight of optimistic and pessimistic market sentiment, which occurs throughout daily trading periods. The absence of detailed data creates circumstances where you will navigate without full visibility of needed information.
Candlestick patterns offer a solution. Throughout several centuries, Japanese rice traders developed these patterns, which enhance understanding of price movement through complex patterns. The four essential price points of each time span create a candlestick that reveals the prices’ highs and lows along with the opening and closing values. A deeper market sentiment analysis becomes possible for you by mastering the interpretation of these patterns to help you make better trading choices.
This extensive tutorial explores all aspects of candlestick pattern discovery. The guide begins by describing the fundamental meaning of an individual candlestick. This guide examines how individual candlesticks create patterns and details some internationally used and effective patterns that traders employ. The guide will teach you how to use these patterns with emphasis on confirmation testing as well as context analysis and the fundamental requirement of risk management. Your candlestick chart reading ability will be sufficiently developed when you finish this lesson.
(A brief, optional historical note): The candlestick chart’s origin stems from 18th-century Japan under the development of Munehisa Homma, who traded rice. At the end of his trading career, which extended over many years, he formulated market psychology principles that ultimately led to the creation of candlestick analysis.
The Building Blocks: Understanding a Single Candlestick
To understand the patterns, we first need to grasp the various components, which include candlesticks. Candlesticks act as small depictions of particular trading time periods. Each trading period symbolized by a candlestick represents an interval that might last from one minute to a complete week based on which chart timeframe is displayed.
“Let’s break down the anatomy of a candlestick:”
The Building Blocks: Understanding a Single Candlestick
Among all parts of the candlestick chart the rectangular section known as the Body presents the most significance. During the chosen period, the Body section shows the opening price difference from the closing price.
Bullish Candlestick (Green/White/Blue): The bullish candlestick maintains a green or white or blue color which indicates that closing prices exceed opening prices thus representing buyer dominance. The market participants who bought during this period gained control of the price as they caused it to rise. The bulls achieved their goal when closing prices exceeded opening prices so it functions as their victory.
Bearish Candlestick (Red/Black): A Bearish Candlestick (also known as Red or Black bar) forms when closing price falls below opening price thus indicating bear market control. During this period, sellers exercised their dominance, thus lowering the price. The bulls achieve success during this outcome.
Body Size: Organizations need to analyze the relationship between the cost opening and the cost closing because it determines the direction of market prices. The size of the body shows whether price moved powerfully in one direction (long body) or stayed relatively calm (small body).
The Wicks (Shadows):
The wicks (shadows) are thin lines that appear above and beneath the body interval. During the trading period, the wicks symbolize both maximum and minimum prices that traders achieved.
Upper Wick (Upper Shadow): During the specified period, the highest trading price across all trades becomes visible as Upper Wick. Sellers entered the market at this point, thereby surpassing buyers so that price could no longer rise.
Lower Wick (Lower Shadow): During the period, the asset reached its lowest level of value at Lower Wick (Lower Shadow). Whenever buyers gained control over sellers, the market reached its resistance point to stop further price drops.
Wick Length: Wick length provides additional information through its measurement. The length of the wick suggests both high market volatility together with strong rejection of prices at a certain point. The price movement remained near the beginning and ending levels as shown through short candle wicks.
Key Price Points:
Open Price: “The price at which the asset started trading for the period.”
Close Price: “The price at which the asset finished trading for the period.”
High Price: “The absolute highest price reached during the period.”
Low Price: “The absolute lowest price reached during the period.”
Timeframes:
A candlestick poster reflects a designated trading period. A single candlestick span indicates the market price movement across one minute. One daily candlestick demonstrates all trading day price movements. The price movement throughout an entire week appears as a single candlestick in the weekly time frame. Different time settings on your charting platform provide various market perspectives.


From Candles to Patterns: Understanding Candlestick Patterns
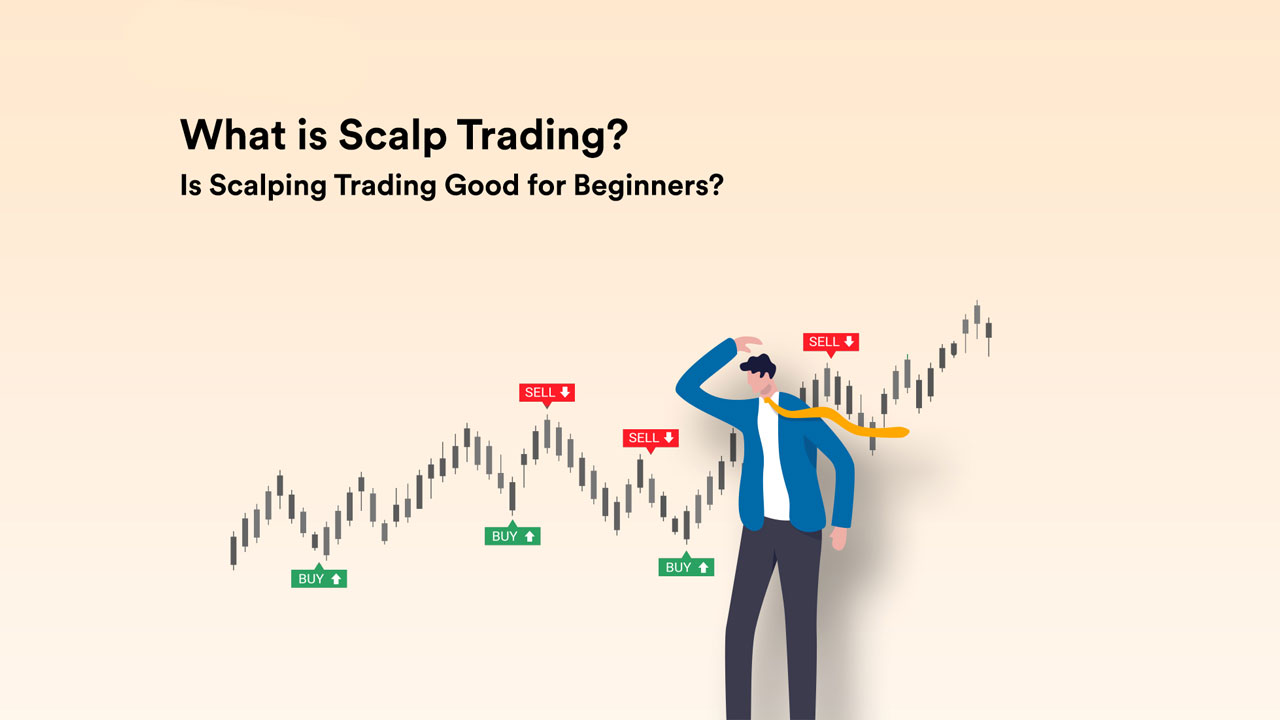
The stock market technique of scalping works on the assumption that most stocks will complete the first phase of price movement. However, after the first phase, it becomes hard to figure out where it will go from there. This is the main idea behind scalping. This ensures that the investor makes use of the movement rather than waiting for the stock price to move further after the initial phase.
Investors who engage in scalping are known as scalpers, and they believe that it is better to make small profits in several trades in a day than to take risks in a single trade. Even though their profits may be small and they risk losing out on larger profits, their trading volume allows them to make a considerable amount of profit.
“Candlestick patterns can be broadly categorized into:”
Single Candlestick Patterns: Single candlestick patterns exist as patterns that depend on the formation of one candlestick. These patterns serve the purpose of delivering swift direction about current market attitudes.
Multiple Candlestick Patterns: The identification of multiple candlestick patterns appears when analyzing two or more candlesticks. Multi-candlestick patterns generate more powerful trading signals because they analyze greater amounts of price action information.
Reversal Patterns: These patterns show indications that the present market direction may be about to modify. A bullish reversal pattern appears during downtrend endings, which indicates the price will probably start an upward movement. A bearish reversal pattern emerges during an uptrend to signal possible price downward movement.
Continuation Patterns: Continuous trends become apparent through these patterns, which indicate the present direction is set to persist. The price continues in its upward trajectory when a bullish continuation pattern emerges in an uptrend situation.
Common Candlestick Patterns: A Closer Look
The following section examines prevalent candlestick formations that people can easily recognize. The discussion includes complete coverage of single and multiple candlestick patterns and shows both reversal and continuation examples. These patterns serve as your starting basis, but additional patterns exist in the market, so use them to build your foundation.
A. Single Candlestick Patterns:
Doji:
Visual: The candlestick pattern has such tiny body involvement that open and close values overlap each other substantially. The candlestick patterns display a shape comparable to both crosses and inverted crosses and the simple + symbol.
Description: This candlestick pattern shows complete market stalling since traders have reached a standstill state. Both market participants maintain equilibrium at this point because no party can take over the market direction. The lengths of wicks may differ from one Doji to another.
Interpretation: A Doji candle stands alone as an indicator for neither signaling market reversal nor indicating price changes. Doji signals that an upcoming trend divergence could be ahead because current market momentum is losing momentum. The price action preceding a Doji along with the present market factors determines its important value.
Example Scenario: A stock showing multiple days of continuous uptrend creates this scenario where a Doji forms. Suddenly, a Doji appears. The exhaustion of buyers and rising strength in sellers explain this market situation. A Doji pattern indicates that you need additional evidence to verify the durability of an uptrend.
Variations: The Doji pattern exists as variations. They include long-legged Doji featuring long wicks and Dragonfly and Gravestone, which present specific wick characteristics. The different versions of the Doji pattern share slightly altered meanings, although indecision stands as their main concept.
Hammer/Hanging Man:
Visual: A small body located near the top of the candlestick’s range, with a long lower wick (at least twice the length of the body) and little or no upper wick.
Description: “These patterns are identical in appearance, but their interpretation depends on where they appear in the trend.”
Hammer: “Appears after a downtrend. It suggests that buyers stepped in strongly at the lows, pushing the price back up and potentially signaling a bullish reversal.”
Hanging Man: “Appears after an uptrend. It suggests that sellers were able to push the price down significantly during the period, even though buyers managed to recover somewhat. This can be a warning sign of a potential bearish reversal.”
Interpretation: “The long lower wick indicates strong buying pressure (Hammer) or selling pressure (Hanging Man) at a particular price level. The small body suggests that the opening and closing prices were relatively close, despite the volatility during the period.”
Example Scenario (Hammer): “A stock has been declining for several weeks. A Hammer appears, showing that buyers aggressively defended a particular price level. This could be a sign that the downtrend is nearing its end.”
Example Scenario (Hanging Man): “A stock has been rising steadily. A Hanging Man appears, indicating that sellers exerted significant downward pressure. This could be a warning that the uptrend is weakening.”
Spinning Top:
Visual: A small body with relatively long upper and lower wicks.
Description: “Similar to the Doji, the Spinning Top indicates indecision. However, unlike the Doji, the Spinning Top shows more volatility during the period, with both buyers and sellers having some success, but neither gaining a decisive advantage.”
Interpretation: “A Spinning Top suggests a period of consolidation or uncertainty. It’s often seen as a sign of potential trend exhaustion, but it’s not a strong reversal signal on its own.”
Example Scenario: After a sustained uptrend, if multiple spinning tops appear, it could signal the uptrend is running out of steam.
Marubozu:
Visual: A long body with little or no wicks.
Description: “The Marubozu represents a strong, decisive move in one direction.
White/Green Marubozu: “The price opened at the low and closed at the high, indicating strong bullish momentum.”
Black/Red Marubozu: “The price opened at the high and closed at the low, indicating strong bearish momentum.”
Interpretation: “A Marubozu is a sign of strength in the direction of the candle. It suggests that the trend is likely to continue, at least in the short term.”
Example Scenario (White/Green Marubozu): “After a period of consolidation, a White Marubozu appears, breaking through a resistance level. This suggests a strong breakout and a likely continuation of the upward move.”
B. Multiple Candlestick Patterns:
Engulfing Pattern (Bullish/Bearish):
Visual: Visual: A two-candle pattern. Two sequences of candles exist within this pattern, with the first small red one then followed by the second larger green candle completely absorbing the first red body.
Description:
Bullish Engulfing: “The first candle is bearish (red/black), and the second candle is bullish (green/white) and engulfs the first candle’s body.”
Bearish Engulfing: “The first candle is bullish (green/white), and the second candle is bearish (red/black) and engulfs the first candle’s body.”
Interpretation: “The Engulfing pattern is a strong reversal signal. It suggests a significant shift in momentum from one direction to the other.”
Example Scenario (Bullish Engulfing): The stock demonstrates a bearish tendency while a downward trend exists. The formation shows how a tiny bearish candle is replaced by a large bullish candle, which consumes the entire body of the first candle. The buying momentum has reached a point where sellers no longer impose control over prices, and thus a price correction is expected.
Example Scenario (Bearish Engulfing): The example scenario shows a bearish engulfing pattern in which the stock maintains an upward trend (bearish engulfing). The pattern occurs when a short bullish candle gets consumed inside a larger bearish candle that overtakes its body. The pattern indicates sellers now dominate the market, so a market decline is expected to occur.
Morning Star/Evening Star:
Visual: A three-candle pattern.
Description:
Morning Star (Bullish Reversal): Morning Star patterns display three candles, with the first one being a prolonged bearish candle. A small-bodied candle follows the first candle with an ability to form in bullish or bearish patterns and it creates downward gaps from the first candle. A long bullish candle follows the second candle, which opens above it and fully penetrates the body of the initial bearish candle.
Evening Star (Bearish Reversal): Early phase detection starts through a lengthy positive session followed by two additional components. The second candle shows itself as a short and compact nontrending shape that opens above the previous candle body. A long bearish candle appears as the third pattern, which moves downwards from the second candle and crosses into the body of the initial candle.
Interpretation: The interpretation reveals that such formations indicate powerful market reversals. The Morning Star pattern indicates changing bearish to bullish momentum, and the Evening Star pattern shows changing bullish to bearish momentum. A short period of ambivalence and transition takes place between the first and third candles.
Example Scenario (Morning Star): In the case of Morning Star we can see that the stock price shows a downtrend direction. After a long downward-moving candle follows a brief Doji or spinning top candle that makes a price decrease. A substantial bullish candle appears following the bearish pattern by opening above its first closing price and showing significant movement that ends within the body of the initial bearish candle. When this pattern develops it points toward an emerging bullish trend.
Three White Soldiers/Three Black Crows:
Visual: Three consecutive long-bodied candles.
Description:
Three White Soldiers (Bullish Continuation): “Three consecutive long-bodied bullish candles, each closing near its high.”
Three Black Crows (Bearish Continuation): “Three consecutive long-bodied bearish candles, each closing near its low.”
Interpretation: “These patterns are strong continuation signals. They indicate that the current trend is likely to persist. The three consecutive long candles demonstrate strong and sustained momentum.”
Example Scenario (Three White Soldiers) In an uptrend, if Three White Soldiers appear after a brief period of consolidation, it reinforces the strength of that uptrend.
Harami (Bullish/Bearish):
Visual: A two-candle pattern. A large candle starts the pattern, followed by a smaller candle that stays entirely inside the body of the preceding candle.
Description:
Bullish Harami: A Bullish Harami occurs when the first candle is negative, followed by a smaller Bullish candle completely enclosed inside the opening and closing range of the first candle.
Bearish Harami: This reversal pattern consists of a red and a white candle, where the white one remains inside the body of the previous red candle.
Interpretation: The Harami pattern indicates that the ongoing trend might face weakening conditions. The Harami pattern demonstrates weaker reversal potential than the Engulfing pattern, yet it remains valuable, especially during combination use with other analytic measures.
Example Scenario (Bullish Harami): When a strong downward tendency shows itself through a long red/black candle, a shorter green/white candle emerges entirely within the earlier candle range. The price patterns suggest an upcoming slowdown in downtrend movement, which might lead to a new market direction.
Using Candlestick Patterns Effectively: Beyond Recognition
Detecting candlestick patterns serves as only the first part of the process. When employing these patterns successfully, you need to move past pattern identification alone since various additional elements need examination.
Confirmation is King:
According to the author, this principle stands as the most vital guideline. Candlestick pattern identification must never serve as the single factor for opening trades. Technical decisions should always require confirmation from additional indicators or factors. Every pattern, regardless of strength, may prove incorrect. Verification of multiple signals strengthens the chances for dealing success.
Essential Technical Indicators for Confirmation:
Trendlines: A trader should identify the current market trend before examining any candlestick formations. The market shows an upward direction or downward direction or remains static. A bullish reversal pattern holds stronger value when spotting it at the end of a downward trend rather than during sideways or upward trends.
Support and Resistance Levels:
Market participants use support and resistance levels among key price areas so market forces create buying support (support) or selling resistance (resistance). A candlestick pattern recognized near established support or resistance points demonstrates higher meaning.
Example: The signal strength of a hammer pattern increases substantially when it occurs near strong established support levels.
Moving Averages: Moving averages function as smoothing lines of price data to indicate market trends. Nonetheless, the most frequently used moving averages consist of the 50-day and the 100-day together with the 200-day moving averages. Team up candlestick patterns with moving averages to establish trends either in their early stages or to validate their ongoing state.
Example: An engulfing pattern with bullish characteristics that develops near an upward trend of the 50-day moving average provides stronger predictive potential than an engulfing pattern that appears alone.
Volume: The trading amount of shares or contracts represents the volume statistic for a certain timeframe. Volume serves as an essential sign to measure price movement strength. An indicator for reliable candlestick pattern analysis is high trading volume because it enhances the strength of the price signal compared to patterns with low volume.
Example: A Bullish Engulfing pattern appearing during periods of exceptionally high volume produces much more significant signals compared to Bullish Engulfing patterns occurring with lower trading activity. The high trading volumes serve as confirmation that numerous participants back this market trend.
Momentum Oscillators (RSI, MACD): Momentum oscillators, including RSI and MACD, function as tools that evaluate both price speed along with its variations. The indicators help traders discover when prices exceed normal value ranges so they validate the patterns formed by candlesticks.
RSI (Relative Strength Index): The RSI indicator operates by showing that readings exceeding 70 points indicate market overextension, but readings under 30 point to market undervaluation. A reversal pattern based on bullish price activity becomes more important when prices reach oversold levels.
MACD (Moving Average Convergence Divergence):Trading signals for buy or sell occurrences appear through MACD indicators using crossover detections and divergences. The identified signals help verify candlestick chart patterns.
Context is Crucial:
Market context determines how different candlestick patterns should be interpreted because they can hold differing meanings based on overall market conditions. The hammer pattern acts as a possible reversal indicator when observed within strong downtrend markets. In an established uptrend, a hammer symbol typically acts as a short interruption to the continuing upward move. Consider the bigger picture.”
Recent Price Action: What has happened before the pattern formed?
Overall Market Trend: Is the broader market bullish, bearish, or sideways?
News and Events: Are there any significant news events or economic releases that could be influencing the market?
Risk Management: Your Safety Net:
A professional developer must understand that they will encounter losing trades even after mastering candlestick pattern interpretation. Therefore, risk management serves as their essential safety net. Risk management serves as an absolute requirement in trading because of this reason. Before making trades, you need to decide your risk exposure and create stop-loss measures.
Stop-Loss Orders: Investors should use stop-loss orders where these orders execute asset trades at a pre-defined price level. The trading tool helps reduce losses on positions that move against your intended direction. For the stop-loss order, identify a price point that would reverse the confirmed candlestick pattern analysis.
Example: You should set your stop-loss order below the engulfing candle’s minimum point when performing a bullish engulfing trading strategy.
Position Sizing: Every trade should receive a cautious capital allocation limited to 1 to 2 percent of your total investment funds. The standard measure for safe trading capital utilization in each bet stands at 1 to 2 percent. Your trading longevity becomes viable because this strategy protects your position from extended losing phases.
Risk/Reward Ratio: Evaluating potential reward against possible risk stands as the essential component before entering a trade. Bringing the potential profit two to three times greater than the possible loss establishes a positive risk versus reward situation.
Practice, Patience, and Persistence:
Candlestick pattern interpretation needs dedicated practice together with continuous experience recognition. You must not hope to achieve overnight mastery in this field. Beginner traders should start by using demo accounts to practice their skills without exposing actual financial investment. Maintain a trading journal to record every trade and develop your strategy by reviewing your mistakes.
Demo Account:Virtual trading takes place through demo accounts, which most online brokerage platforms provide for customers. The demo account from online brokers serves as a perfect simulation environment to master candlestick pattern strategies.
Trading Journal: Your trading journal should include entries with information about each trade, such as entry and exit prices blended with noticed candlestick patterns and confirmation signals and your trade’s result. Regularly review your journal to identify patterns between winning and losing trades.
The Limitations of Candlestick Patterns: A Realistic Perspective
While candlestick patterns can be powerful tools, it’s important to be aware of their limitations:
Subjectivity: Pattern recognition remains subjective since different traders might interpret the same market data differently into conflicting trading signals. The same chart patterns result in distinct interpretations by different traders, because of which they receive conflicting trading signals. Some traders view a specific pattern as a hammer, while others see it merely as an ordinary candle.
False Signals: The precision of candlestick patterns remains imperfect because certain patterns indicate false signals. These patterns occasionally fail to produce correct signals. Risk management, together with confirmation, represents essential tools because of this reason.
Not a Crystal Ball: These candlestick patterns exist as probability indicators rather than definite predictors. No indicator can deliver definite future price movement because they only offer directional hints. The trading environment features multiple impacting elements while any forecast method fails to predict market developments precisely.
Market Manipulation: Market participants like institutions might manipulate prices through their actions, which creates traps to capture smaller traders. Academic circles about price manipulation indicate that it mostly appears in markets with low trading volumes.
Lagging Indicator: Candlestick patterns derive their analysis from historical price movements since they rely on previous price-related data. These indicators show past data only while providing no probable future information because they function as lagging indicators. The patterns serve well to detect upcoming market trends but provide no definite knowledge about tomorrow.
In Conclusion: Your Journey to Candlestick Mastery
Using candlestick patterns provides a visual method to determine market emotion so that you can make better trading choices. By mastering the identification of these patterns alongside market analysis, you will obtain better results in price movement forecasting.
Candlestick analysis exists as a continuous method that you must practice. Strong determination along with regular practice and continuous learning forms the requirements to master these methods. Begin by learning basic principles, then focus on risk prevention and confirmation before learning alternative technical patterns.
Call to Action:
Start Practicing: Begin practicing by using charting software while detecting the patterns mentioned here. Review both multiple periods and multiple trading instruments. The frequency of your practice sessions will improve your ability to detect patterns when trading in real-time conditions.
Learn More: Users will discover additional information from this article, which functions as an initial groundwork. Other educational materials, including books, websites, and online courses about candlestick patterns and technical analysis, exist for you to enhance your knowledge.
You can access reputable information about technical analysis from Investopedia as well as the resources available at Steve Nison’s website and through their selected YouTube channels.
Demo Trade: Students should use demo accounts for training purposes before they start betting their own cash. The demo trading feature enables strategy testing while eliminating any potential financial risks for traders who want to build their confidence levels.
Join a Community: Create a community through digital or physical connections that permits traders to both exchange technical knowledge and receive guidance from fellow members.
Develop a Trading Plan: You need to establish a trading plan due to the fact that random trading will not work. Develop a trading plan as a written document that describes your trading techniques alongside risk control regulations and target information. Your trading strategy needs daily reviews for consistency. Stay on track with your original plan.
Questions?: If you have queries or comments, feel free to post them since I will address them personally.