

Introduction Of Bullish Marubozu Candlestick
One Bearish Marubozu candle in a price chart serves as a clear indicator that investors are completely in control. A bullish Marubozu provides power to traders because of its display of total buyer control. Candlestick patterns function as market visual signals that show the current struggle between buying and selling activities. Bullish Marubozu emerges as a straightforward indicator for bullish market control from all other candlestick patterns. Such powerful tools must be properly utilized after gaining a comprehensive understanding of their functions.
Inexperienced traders often develop strong interest in the Marubozu pattern, yet they discover difficulty in spotting this formation in real trading situations, which results in both missed chances and unnecessary trading losses. Learning to recognize Bullish Marubozu patterns in this guide provides you with all the necessary knowledge. The complete guide covers every aspect of the Bullish Marubozu, including an exact definition, advanced trading methods, and instances of non-trading. The PDF guide includes a checklist and delivers a summary of all information, which you can download for free.

What is a Bullish Marubozu Candlestick Pattern?
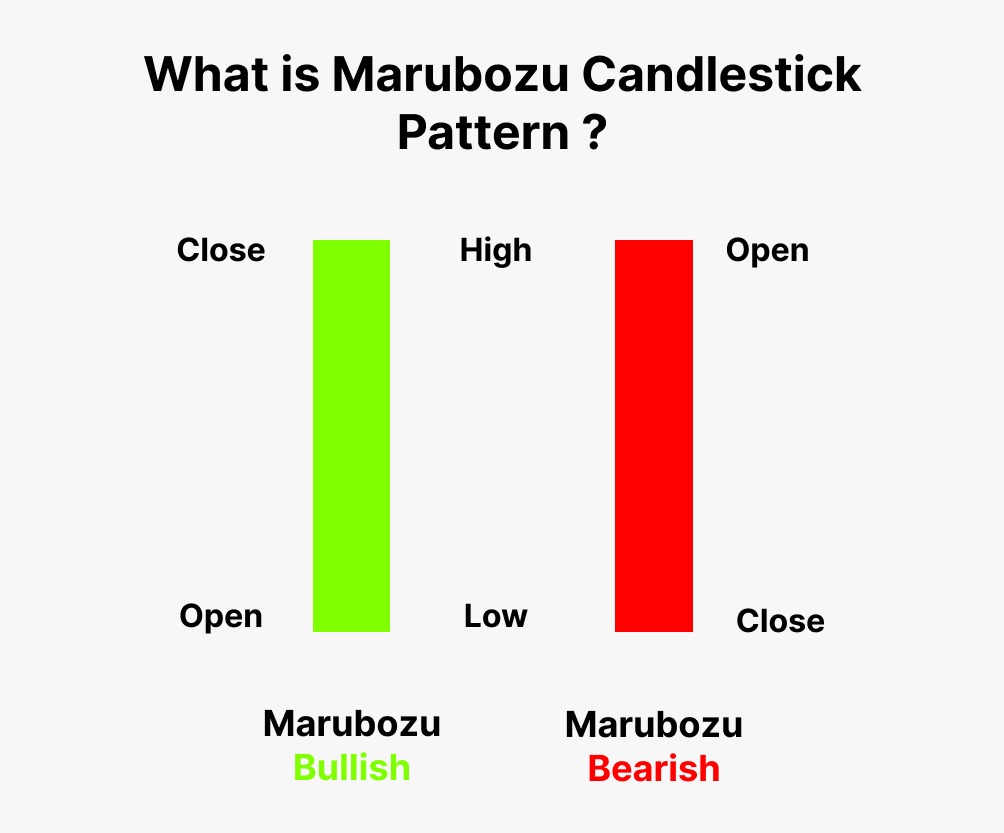
Let’s start with the basics. Within the Japanese language, ‘Marubozu’ represents ‘close-cropped’ together with ‘bald head’ through translational meaning. The visual characteristic of the candlestick matches its definition precisely. A bullish Marubozu on the chart appears as an elongated solid body that usually displays green or white coloration in standard charting software. The most crucial feature? The body of this candlestick contains minimal or no wick formations, which develop from either its upper or lower edges.
The visual depiction of candlesticks illustrates bidding market action (bulls) against selling market action (bears) during dedicated periods, including days, hours, or 4-hour intervals. The body section of the candle stands for the numerical gap between market opening values and market closing values. During the specified period, the candles display both maximum and minimum prices achieved.
A Bullish Marubozu, with its long body and lack of wicks, tells a compelling story:
The Open is the Low: During the period, the price opened at its lowest possible point, which signifies control by buyers from the market opening. The price system started at its minimum value, which demonstrated that buyers asserted their dominance since the market launch.
The Close is the High: The price reached its most elevated position during the examined period when it closed. The continuous upward price trend during the session showed that buyers kept their power from beginning to end.
Minimal Wicks: A minimum amount of wicks reveals weak selling pressure during this period. Market forces operated with the bears being completely vanished from price manipulation activities throughout the trading period.
The Psychology of the Bullish Marubozu: Reading the Market's Mind
The Bullish Marubozu power emerges from the psychological market signals it presents. Such formations show remarkable enthusiasm from buyers regarding future market trends. A stock that continues declining in a steady pattern. Suddenly, a bullish Marubozu appears. Such an event signifies an enormous shift of power dynamics. Premature buying activity has proven too powerful for sellers, resulting in increased market prices.
This can be due to several factors:
Positive News: When a company releases positive news relating to financial performance, product development, or regulatory decisions, this creates strong buying pressure.
Institutional Buying: Institutional investors who hold control over large investment funds like hedge funds and mutual funds execute buying transactions that propel share values upward.
Short Covering: During price rises, traders who engage in short selling must repurchase stock to close their positions because this forced buying pressure creates additional market strength.
Breakout from Consolidation: A Marubozu appears during consolidation periods, leading to an official price upswing.
Marubozu Variations: Nuances in the Bullish Signal
A Bullish Marubozu holds its strongest bullish meaning even if it features minimal wick activity. Your trading decision refinement becomes more effective through an understanding of subtle variations.
Full Marubozu
Full Marubozu patterns represent the most perfect variation because they contain no upper or lower wicks. The full Marubozu pattern shows absolute dominance of buyers because it signifies the ideal bullish signal.
Opening Marubozu
Opening Marubozu occurs with no lower wick, making the open equivalent to the session low and a potential small upper wick formation. The initial market control remained with buyers while very light selling pressure emerged at the final market minutes. A bearish wick gives a bullish sign yet produces weaker strength than an entire Marubozu pattern.

Closing Marubozu:
The Closing Marubozu pattern does not show an upper wick while sometimes displaying a minimal lower wick. The market participants first displayed selling pressure followed by strong buying force, which sustained through the trading session until closure. This pattern represents a powerful bullish sign that falls behind the full Marubozu in strength.
Wicks should remain small because smaller wick dimensions create stronger signal strength. A candle featuring a long body along with big wicks does not qualify as a Marubozu candle regardless of its bullish direction. The defining feature of this pattern occurs when the body zone overwhelms the wick area.
How to Identify a Bullish Marubozu: A Step-by-Step Guide
The knowledge of theory will help you understand the following practical steps. The following guide shows developers how to spot a Bullish Marubozu pattern when analyzing their charts.
Choose Your Charting Platform: The majority of charting platforms, including TradingView, Thinkorswim, MetaTrader, and additional platforms, present candlestick chart options to users. Introduce yourself to your charting platform features and customization abilities.
Select the Candlestick Chart Type: Verify that your selected graph demonstrates candlestick patterns because line or bar formats would provide different information.
Look for Long, Bullish Candles: Study the market for large green or white candle patterns that deviate notably from normal candle dimensions.
Examine the Wicks (The Key Step): Wicks serve as the essential part of the examination during this step. The true Bullish Marubozu displays no wicks from its top or bottom body area. Make use of magnification on the candle to examine it properly.
Confirm the Open and Close: Check both prices at the ends of the period for their locations, either at the lowest price or at the highest price. When hovering over a candle with your charting platform, your platform will show the open and close prices.
Consider the Context (More on this in the next section): These candlesticks gain their strength from their surrounding conditions because a bullish Marubozu exhibits superior potential either when positioned inside upward trends or emerging from downward movements or nearby strategic support or resistance areas.
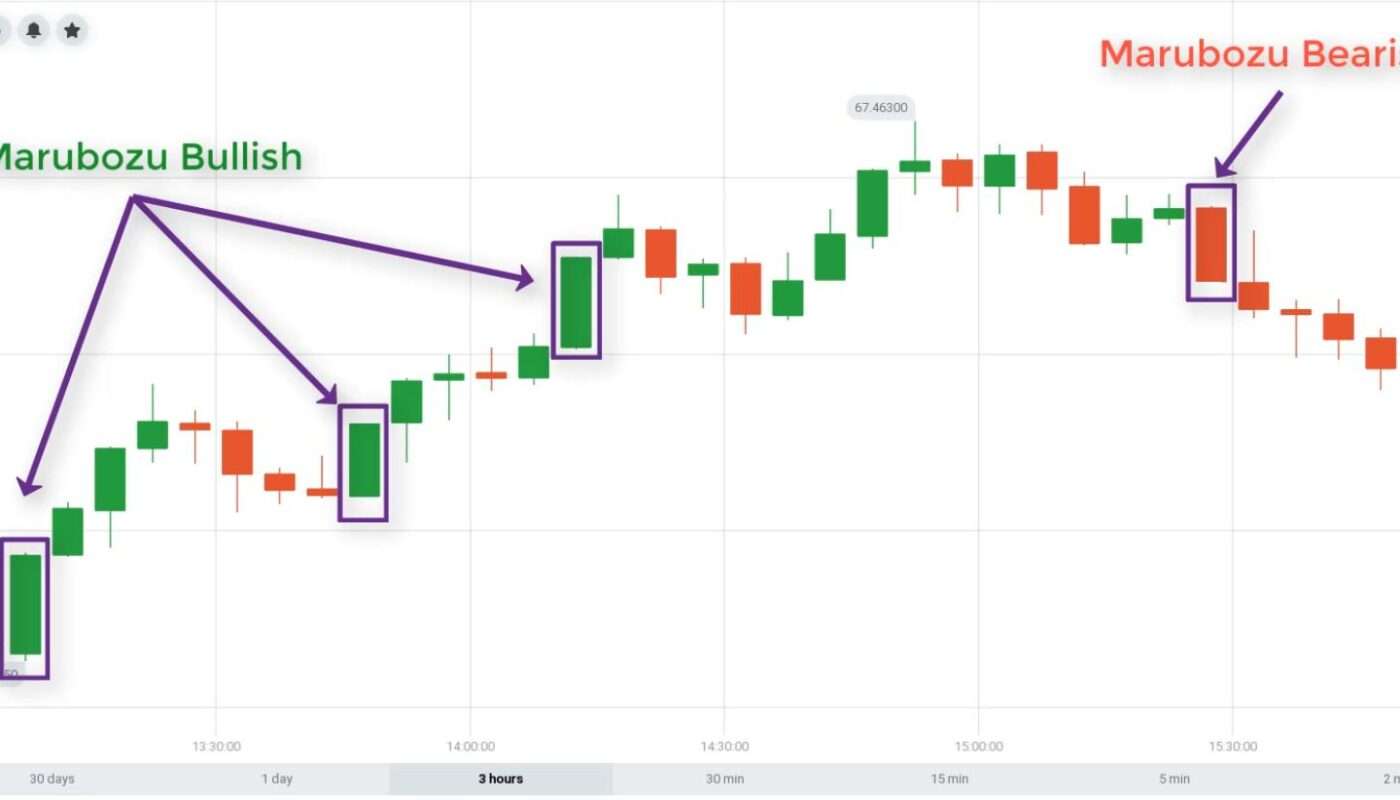
A basic illustration based on TradingView demonstrates this concept. To begin your analysis, you should choose any stock asset and then select a pricing chart view. From the available chart types, select the ‘Candlestick’ view. Observe the chart for extended green-colored candlesticks using visual assessment. To identify one of these patterns, take your pointer over the chart element. The Open, High, Low, and Close (OHLC) metric showing for each candle appears in the TradingView interface. The detection of a Bullish Marubozu pattern becomes more likely when you notice an open point that matches the low point closely while the close point agrees with the high point closely and the candlesticks show minimal wicks or no wicks at all.
Context is King: Trading the Bullish Marubozu Effectively
Most inexperienced traders make their mistakes in this step. The trader initiates a trade immediately after observing a bullish Marubozu and ends up regretful when prices shift in the opposite direction. The Marubozu behaves as any other technical indicator by not functioning as an individual trading signal. A technical indicator must be evaluated within the specific chart position it shows and how other price patterns interact with it for traders to make effective decisions.
Bullish Continuation:
When Bullish Marubozu patterns grow inside an established uptrend, they create a robust affirmation of ongoing bullish market force. The uptrend shows strong signs of continuing because buyers maintain their firm control of the market.
You would verify through other indicators to gain further support for your evaluation of this situation.
Increasing Volume: An exceptionally high volume accompanying a Marubozu pattern enhances the validity of the signal.
Price Above Moving Averages: A price that moves above essential moving averages, including the 50-day or 200-day moving average, functions as additional bullish verification.
Bullish MACD Crossover: When the MACD indicator demonstrates a bullish crossover, it provides confirmation of market momentum based on the technical analysis.
Bullish Reversal:
A bullish Marubozu, which follows an extensive downtrend, serves as a warning of potential market flips. A confirmation of this degree surpasses what a standard continuation pattern requires. The appearance of one Marubozu following a downtrend pattern does not indicate sufficient evidence to reliably declare market reversal.
Here’s what you should look for to confirm a potential reversal:
Break Above Resistance: The price needs to cross above an important resistance level, which appears after forming a Marubozu pattern. The market data shows that buying interest has surpassed selling interest.
Bullish Divergence: An upward divergence will form between price movements and indicator readings on RSI (Relative Strength Index) and MACD. The indicator generates higher lower lows while the price performs lower lows, which signals a decreasing downward pressure.
Increased Volume on Breakout: The strength of a price breakout becomes more powerful when accompanying volume increases substantially after the resistance level is surpassed.
Confirmation Candlesticks: Auditing candlesticks should follow the marubozu pattern by creating more bullish candle formations.
A bullish Marubozu after a downtrend requires further confirmations to differentiate it from a temporary market bounce, which might signal a dead cat bounce.
Support and Resistance:
The location of the Marubozu relative to key support and resistance levels is crucial:
Marubozu at Support: At a well-established support level, a bullish Marubozu pattern becomes more important because of its position. A Marubozu formation performs as a base floor protection and shows that buying activity occurs at this support level.
Marubozu Breaking Resistance: The cutting of resistance through a Bullish Marubozu constitutes an extremely robust bullish indicator. This technical indicator demonstrates that market players have passed a major point of resistance, so the price will probably continue toward higher levels.
The Importance of Volume:
Volume operates as the essential power to guide price changes in the market. The Bullish Marubozu pattern gains substantially greater meaning when it occurs with high trading volume. Volume increases indicate intense belief among purchasing participants. A bullish Marubozu pattern that occurs with low-volume bars requires extra careful analysis. A lack of conviction together with an increased risk of false indicators appears when this pattern forms.
Other Indicators (Briefly Mention, Expand on a Few):
You need additional technical indicators to validate your Marubozu-based analysis even though this pattern presents robust signals. Here are a few to consider:
Moving Averages: When price moves above essential moving averages ranging from 20 to 200 periods, this enhances the validity of a trade. The combination of short-term moving averages crossing above longer-term moving averages produces what traders call a ‘golden cross.’ This serves as a highly bullish indicator.
RSI (Relative Strength Index): The RSI stands as an oscillator tool that calculates recent price change magnitudes to help determine price trends between overbought states and oversold areas. RSI values exceeding 50 indicate rising bullish conditions on the market. The entry of RSI into bullish territory from under 30, while accompanied by a Marubozu, shows a strong indication of bullish activity.
MACD (Moving Average Convergence Divergence): The technical indicator MACD functions as a momentum oscillator among other analytical tools. The signal that confirms a bullish trend appears when the MACD line crosses above its corresponding signal line. The Marubozu pattern should look for a price crossover to take place at its formation time.
Fibonacci Retracements: The Fibonacci retracements provide traders with valuable levels to predict where Marubozu candlesticks might develop or penetrate these support and resistance points.
Bollinger Bands: The upper Bollinger band represents a very strong trend when a marubozu closes beyond its boundaries.
Trading Strategies with the Bullish Marubozu: Entry, Stop-Loss, and Take-Profit
We can combine all previous information to explain proper trading procedures for Bullish Marubozu patterns. Trading with an optimal approach does not need to be perfect because it should reflect your individual risk tolerance as well as your chosen trading style.
Entry Points:
Aggressive Entry: The trader should open a buy position at the market immediately after the bullish Marubozu completes its closing cycle. With aggressive entry, you accomplish the most rewards, yet this methodology additionally includes the greatest risk of generating a wrong signal.
Conservative Entry: You should wait until one more confirmation candle forms after the Marubozu to enter a trade. The trader can choose to enter the market after the next bullish candle appears or after a brief price pullback to a support line. Safety increases through this method, yet you could possibly lose opportunities during the initial price movement.
Breakout Entry: To execute this strategy, enter a long position after the price moves above the maximum value that the Bullish Marubozu reached. The price continues rising because buyers maintain their dominance in the market.
Stop-Loss Placement:
A stop-loss is essential to protect your capital. Here are some common stop-loss placement strategies:
Below the Low of the Marubozu: The standardized technique uses the Low of the Marubozu as its base. A declining price that touches levels below the low point of the Marubozu causes the bullish prediction to become unreliable.
Below a Nearby Support Level: You can set your stop-loss order at a position just below adjacent support levels when seen near a Marubozu.
Below a Moving Average: Subordinate to your moving average, you can establish a flexible stop-loss at 20-day average periods.
Take-Profit Targets:
Setting a take-profit target helps you lock in profits and manage your risk/reward ratio. Here are some options:
Projected Based on Previous Price Swings: Measure the distance of past price swings to project a similar movement starting from the entry price point.
At the Next Resistance Level:Identify the following substantial resistance level that stands above your entry point, then position your take-profit target slightly beneath it..
Using a Risk/Reward Ratio: The 1:2 or 1:3 risk/reward ratio represents a normal method for traders to utilize when determining their trade strategy. Your entry price determines the stop-loss at 1% below, while your take-profit target should be set at 2% to 3% above the entry point.
Trailing Stop: Your stop-loss order can follow the price upward when it moves favorably and both enables profit protection and prevents price reversals.
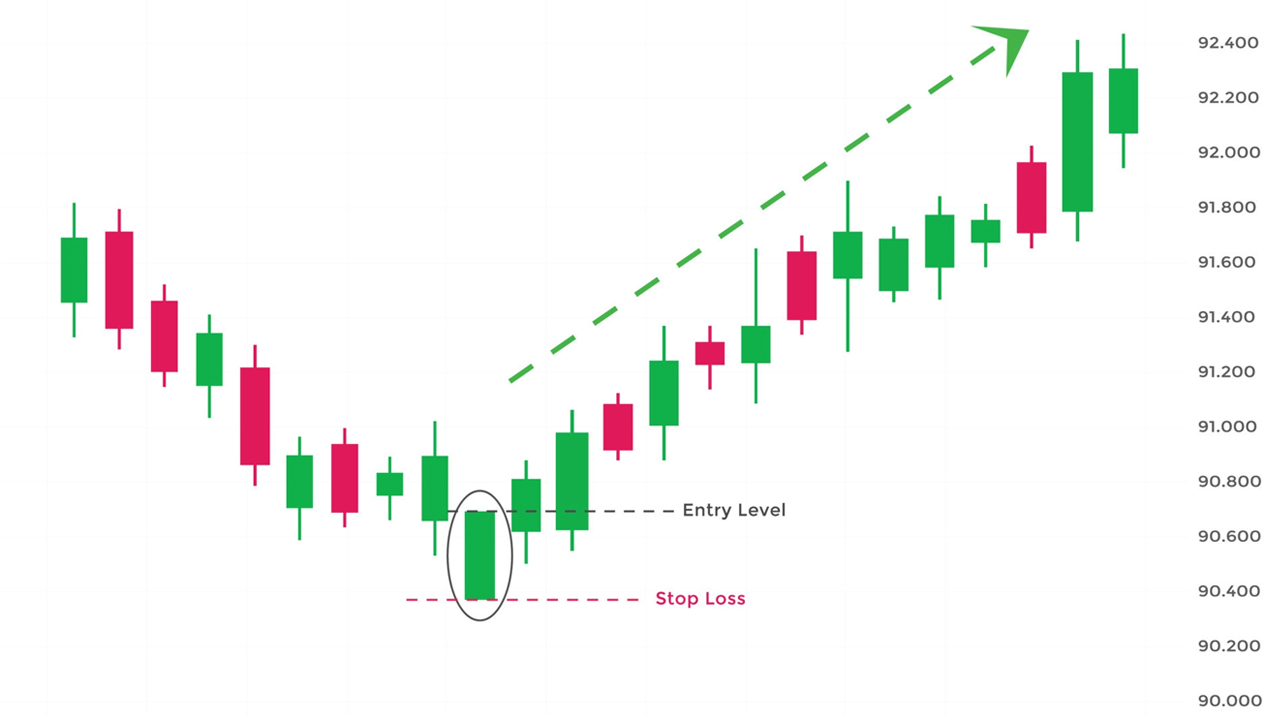
Example Trade Setup (Detailed Explanation):
Moving onto a theoretical trading arrangement, we will apply the illustration of the recent chart we constructed. A bullish Marubozu pattern develops, which breaks through a main resistance barrier following market consolidation. The trading volume reached levels above normal standards as the RSI crossed above 50.
- Entry: A breakout entry is our approach for this system. A buy order should be placed above the Marubozu candle’s maximum point. The trade entry happens only if positive momentum boosts continue.
- Stop-Loss: The stop-loss should be established just below the Marubozu low point. The trade has flexible entry conditions, yet it maintains a safety zone in case the breakout operation fails to materialize.
- Take-Profit: We will mark the first important resistance area that lies above our entry level as our take-profit target. New positions will depend on prior price peaks or Fibonacci expansion points. To maximize the take-profit success chances, we will position the target immediately below the determined resistance zone.
- Risk/Reward: We will place our entry and stop-loss points $2 apart. Our entry price serves as the baseline to calculate our take-profit target, which will be set at $4 higher than the entry point through a 1:2 risk/reward ratio.
- Trade Management: The start of our trade marks its beginning, but we should always keep the trade in active focus. Price monitoring becomes essential when our take-profit point comes within reach since price reversals require extra caution at that time. The trade should experience stop-loss movement as its value increases.
Another similar situation exists in the global market. Develop your trading approach more specifically according to how well the market conditions match your personal tolerance for risk. Creating an operative trading plan precedes entering the market.
Limitations and Risks: The Reality Check
The Bullish Marubozu proves insufficient as a standalone trading tool since it shares the same flaws with all technical indicators. Trading losses will occur at times when the Bullish Marubozu indicator produces misleading signals. Adverse results are inevitable elements of trading practices.
False Signals: The accuracy of any trading pattern remains totally unpredictable. A bullish Marubozu shows up before prices experience a countertrend movement. Because confirmation and context represent essential elements for understanding markets.
Market Volatility: The price movements of volatile markets become hard to predict because they remain unpredictable. The appearance of a powerful Marubozu remains fragile, as a market sentiment change can cause it to lose its validity.
Whipsaws: As terms of a Marubozu-generated trade, you could face elimination from brief price movements only to find out that the market keeps moving in its original direction. Market volatility causes this phenomenon, which traders call a ‘whipsaw,’ that frequently happens in unpredictable market environments.
Over-Reliance: You should not depend exclusively on one trading indicator since it becomes unreliable.
Risk Management is Paramount: Risk management functions as the primary element for trading success among all other aspects. Establish stop-loss orders as your primary defense to maintain investment capital. Each trading bet should stay within the scope of capital you are able to lose. Proper position sizing is crucial. Always maintain your trading capital at two percent or lower when entering a single trade.
Call to Action & Your Free PDF Download!
Bullish Marubozu serves as an efficient tool which allows traders to spot strong trading possibilities. The Bullish Marubozu remains easy to use for all traders while its true effectiveness depends on proper interpretation in relevant setups and adherence to safety-focused risk management methods. This guideline has explored many concepts beginning from the fundamental definition through advanced trading methods. This information becomes more accessible by offering a free downloadable PDF summary that consolidates all discussed topics.
What's Inside the PDF Guide?
Concise Summary: A clear and concise overview of the Bullish Marubozu pattern.
High-Quality Charts: Detailed, labeled charts illustrating the different Marubozu variations and trading scenarios.
Identification Checklist: A step-by-step checklist to help you quickly identify Bullish Marubozus on your charts.
Example Trade Setups: Several example trade setups, showing entry, stop-loss, and take-profit levels.
Key Takeaways: A summary of the most important points to remember.
Risk Reminders: Reminding you of all the risks.
The free guide is available for download through the button placed above. Study bullish marubozus patterns on historical charts for identifying them on price charts. Users should employ paper trading to conduct simulations that avoid real money transactions for strategy testing purposes. Focus on risk management while following all guidelines. These are essential final steps to successful trading.
Final Thoughts: Adopting the Bullish Marubozu
Traders should add the Bullish Marubozu candlestick pattern to their essential toolkit because it proves useful for their trading activities. Trading using the Bullish Marubozu indicator becomes effective because this pattern visibly displays bullish market momentum supported by solid market psychology data. The indicator should not be mistaken for automatic profit generation. Effective trading depends upon technical evaluation methods and fundamental evaluation techniques (when relevant) together with risk-management techniques as the most crucial aspect.
The study of this pattern with careful understanding will increase your ability to find profitable trading opportunities through its application and analysis. Experimentation with consistent strategy adaptations coupled with mistake learning should not scare you in your trading process. The disciple of trading stays continuously focused on education and adaptation.
Unlock the potential of the Bullish Marubozu by investing in your free PDF guide and examining the charts properly. Wishing you all the success you need for your trading activities ahead.